Justin Braaten
Remote sensing, data visualization, and research programming
Archive of Selected Work
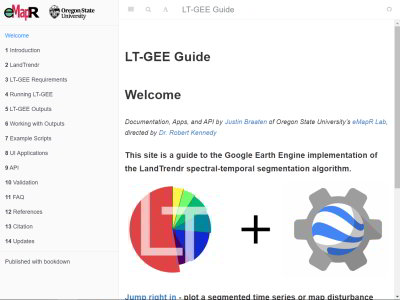
A guide to the Google Earth Engine implementation of the LandTrendr spectral-temporal segmentation algorithm.
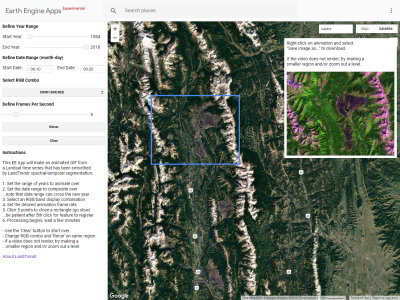
A Google Earth Engine App that will make an animated GIF from a Landsat time series that has been smoothed
by LandTrendr spectral-temporal segmentation.
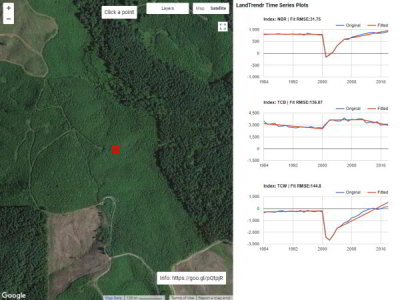
A Google Earth Engine App that plots Landsat surface reflectance source and LandTrendr-fitted index for any selected location on Earth.
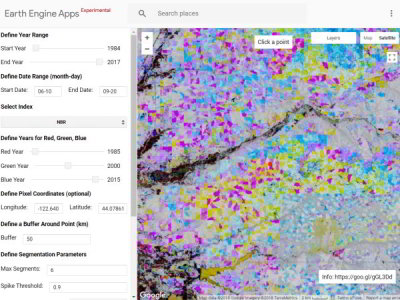
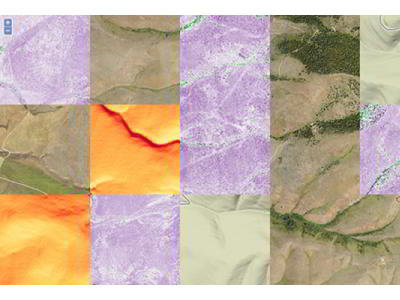
A Google Earth Engine App that displays an RGB color map representing Landsat spectral band or index values at three time slices. It is useful as a quick way to visualize change or non-change over time along with providing a relative sense for spectral intensity.
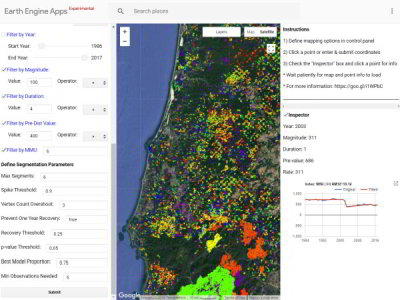
A Google Earth Engine App that will display map layers of vegetation change with attributes including: year of change detection, magnitude of change, and duration of change. It also prints these attribute values for a selected change pixel and plots its spectral time series.
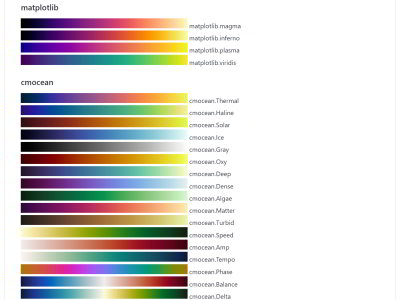
Color palette expansion and documentation for the Google Earth Engine ee-palettes module; A set of common color palettes for Google Earth Engine.
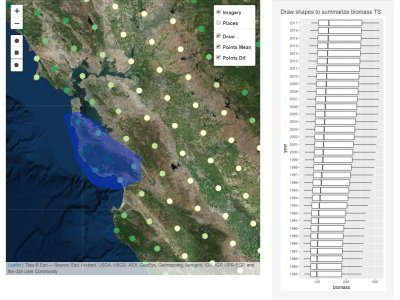
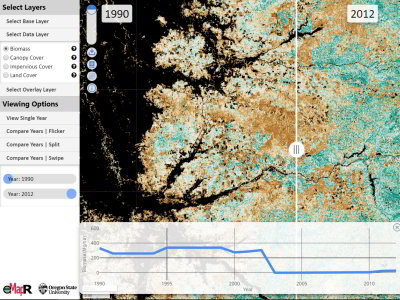
An R Shiny App that summarizes biomass for a given region at an annual time step from 1984 to 2017 for CONUS.
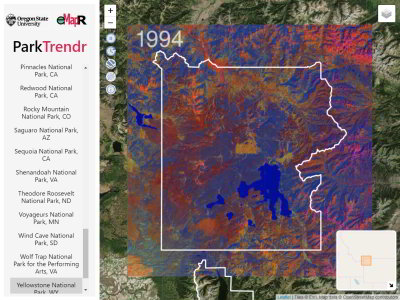
A Leaflet application that displays time lapse videos of satellite imagery from 1984 to 2016 for all of the national parks in CONUS. (I generated the imagery and videos)
Land cover attribute data visualization and download web application.
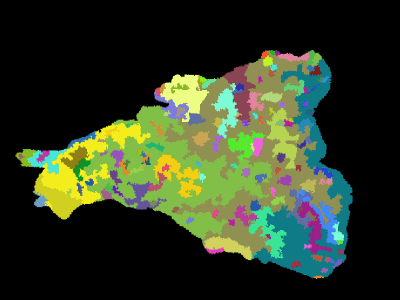
A tutorial on spatially segmenting an image based on biomass distribution for a watershed in Oregon Cascades using Python's scikit-image library.
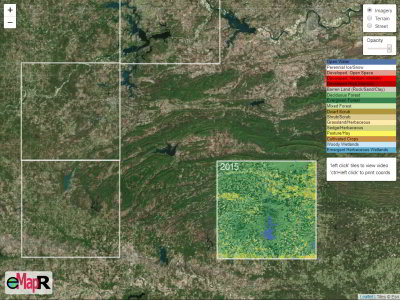
A Leaflet application that contains many random subsets of predicted land cover time series videos for CONUS 1984-2017.
A Leaflet application showing a satellite image time series of the region around MT Hood in NW Oregon 1984-2016.
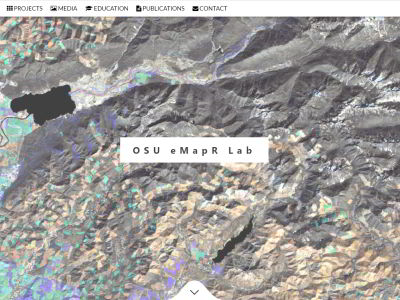
A multi-page research lab website to convey projects, tools, scholarly activity, and share data views. AngularJS was used to dynamically insert HTML blocks based on a JSON array to reduce manual code repetition. It also includes vanilla JavaScript to produce a parallax scrolling effect on the landing page.
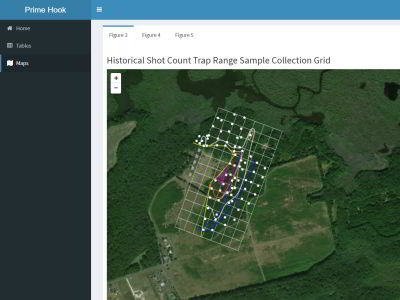
An example of digital environmental site assessment report tables and figures. This application uses R Shiny as the HTML and JavaScript interface and Shinyapps.io as the hosting service.
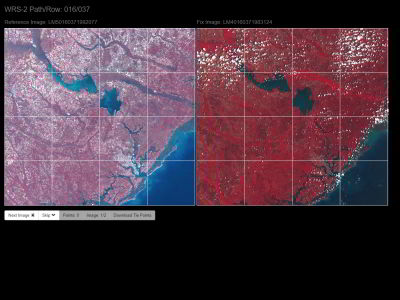
An application to initialize an automated satellite image georegistration program with a few tie points as a hint about where to start. The app uses an image zoom and pan library and custom functions to place and record tie points, keep track of tie points, and allow the user to download placed tie points as a JSON file.
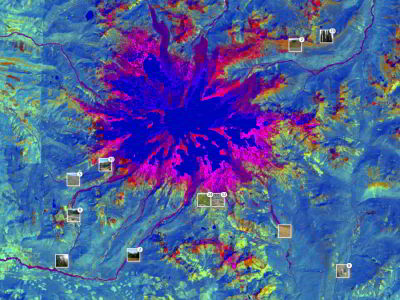
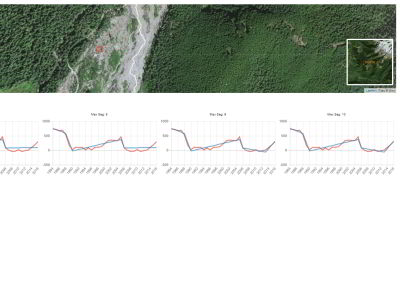
An interactive map that shows geolocated photos for field sites visited in Mount Rainier National Park. Having the georeferenced photos helps interpret the two satellite image base layers.
A tutorial on creating a tile mapping service data set from your own raster data using GDAL.
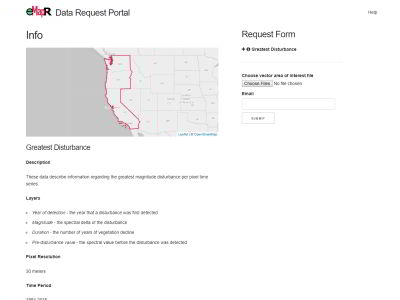
A data download portal for forest disturbance data in Washington, Oregon, and California. This application uses PHP to capture client-side data selection options and initiate server-side Python scripts to process the data request.
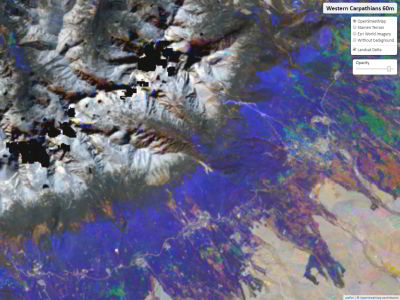
An interactive web map showing vegetation change in the Western Carpathians based on Landsat satellite imagery. Leaflet was used as the web mapping API and jQuery was used for updating image transparency upon slider position change.
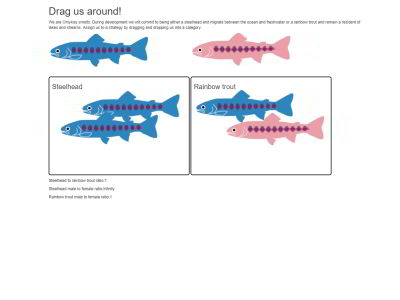
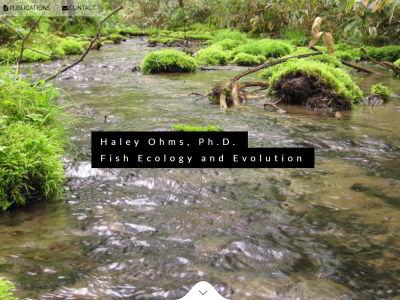
A fishy application for interactively calculating sex ratios. The application uses jQuery to track objects and update calculations upon interaction.
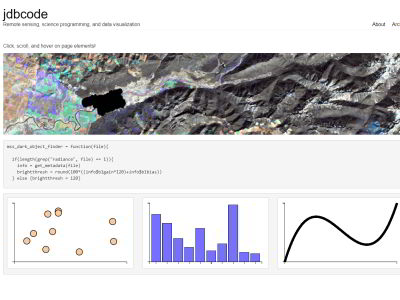
My personal website. A clean example of my love for satellite imagery, coding, and data visualization. D3.js and jQuery are used in the plots, and a neat image magnification function is bound to the satellite image.
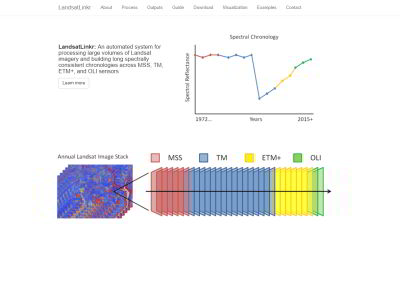
A multi-page site for documenting software I developed to process Landsat satellite imagery.
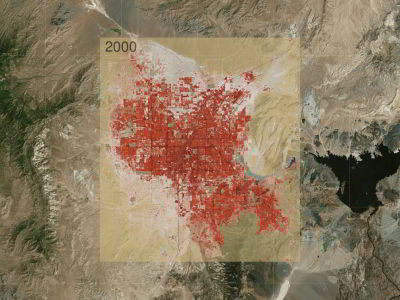
A time-lapse video of urban expansion in Las Vegas based on a 34-year time series of Landsat imagery. Leaflet was used as the web mapping platform.
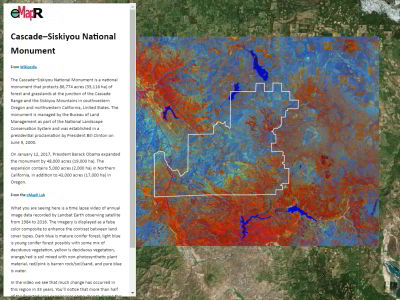
An interactive web mapping application showing a time-lapse video of landscape change, based on Landsat imagery, for a national monument in Oregon. The web mapping platform is Leaflet and it takes advantage of a side panel plugin to convey information about the region.
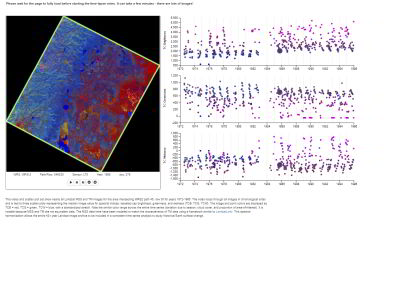
A data visualization showing a time series of Landsat satellite images temporally linked to three spectral transformation plots showing the median value for the image. This page uses D3.js for plotting and jQuery to coordinate the plot and video frames.
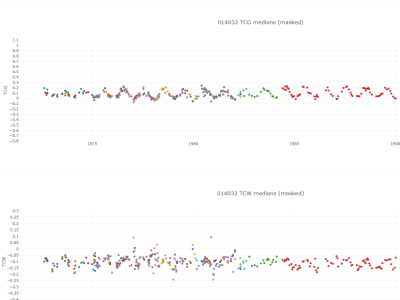
An interactive data visualization showing annual vegetation phenology in Landsat imagery for several spectral indices. The plots are made using Plotly.js.
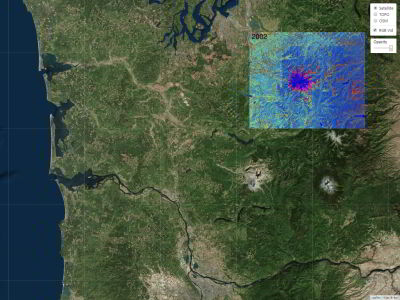
An interactive web mapping application showing a time-lapse video of landscape change, based on Landsat imagery, for Mount Rainier, WA. The web mapping API is Leaflet. The base maps can be switched and the transparency of the video can be adjusted.
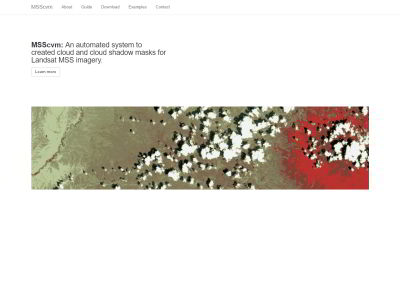
A multi-page site for documenting an algorithm I developed to automate the identification of clouds and cloud shadows in Landsat MSS satellite imagery.
A data visualization showing a series of videos that demonstrate land cover change for a sample of regions throughout the United States.
A personal site for my wonderful wife. It includes vanilla JavaScript to produce a parallax scrolling effect, modals, and a Leaflet location map.
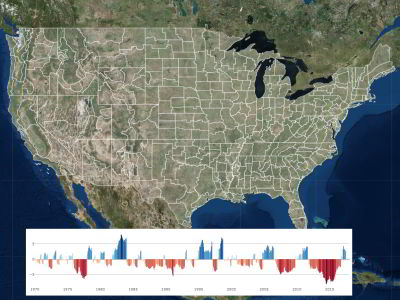
An application that plots Palmer Drought Severity Index time series for regions within the United States. The web map is built with Leaflet and the plotting is handled with Plotly.js.
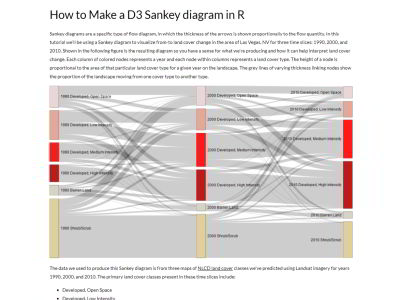
An instruction guide for creating Sankey diagrams showing from-to change for classified land cover maps using R and a D3 integration library.
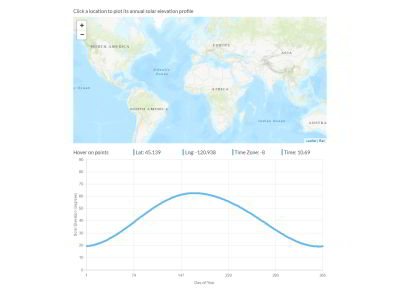
An application to determine the sun angle at the time of Landsat image acquisition for any day and location on Earth. The web map platform is Leaflet and the plotting is handled with the Chart.js API.
A Landsat image time series exploration tool. The application includes a pixel time series profile and image subsets for pixel context. The time series plot was built with D3.js and the image chips are HTML canvas elements. It also includes a time-lapse video of the image chips and a Google Map for added spatial context.
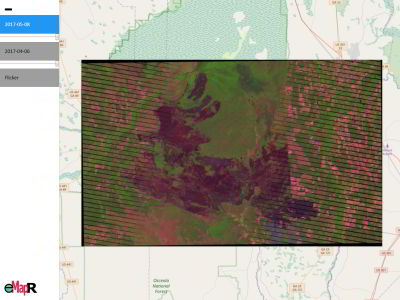
An interactive web map showing pre- and post-fire Landsat satellite images for the 2017 West Mims fire near the border of Florida and Georgia. The application includes a custom side panel with options to toggle image display, adjust transparency, and flicker the images to show fire effects.
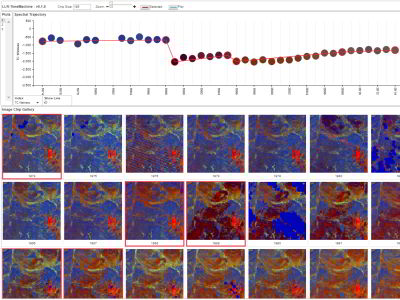
A tool for evaluating the effect of parameter change for a Landsat change detection algorithm. This application uses Leaflet for the web map platform and Chart.js for the plotting.
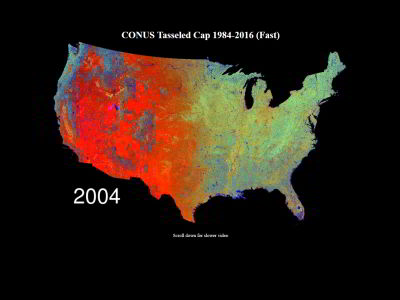
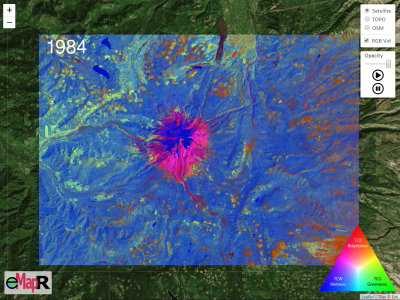
A visualization showing a time-lapse video of spectral change recorded by Landsat satellite sensors from 1990-2016.
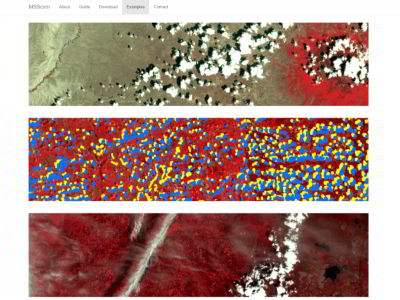
A visual demonstration of a satellite image cloud and cloud shadow identification algorithm I developed. It uses CSS to change the position of an image sprite on hover. This method is much quicker than loading a replacement image, which allows for a seamless transition - a better user experience.
A description page (under construction) for a Landsat-based change detection algorithm. This page uses a scroll position tracking JS library to animate the entry and exit of elements.
Remote sensing, data visualization, and research programming
Archive of Selected Work
A guide to the Google Earth Engine implementation of the LandTrendr spectral-temporal segmentation algorithm.
A Google Earth Engine App that will make an animated GIF from a Landsat time series that has been smoothed by LandTrendr spectral-temporal segmentation.
A Google Earth Engine App that plots Landsat surface reflectance source and LandTrendr-fitted index for any selected location on Earth.
A Google Earth Engine App that displays an RGB color map representing Landsat spectral band or index values at three time slices. It is useful as a quick way to visualize change or non-change over time along with providing a relative sense for spectral intensity.
A Google Earth Engine App that will display map layers of vegetation change with attributes including: year of change detection, magnitude of change, and duration of change. It also prints these attribute values for a selected change pixel and plots its spectral time series.
Color palette expansion and documentation for the Google Earth Engine ee-palettes module; A set of common color palettes for Google Earth Engine.
An R Shiny App that summarizes biomass for a given region at an annual time step from 1984 to 2017 for CONUS.
A Leaflet application that displays time lapse videos of satellite imagery from 1984 to 2016 for all of the national parks in CONUS. (I generated the imagery and videos)
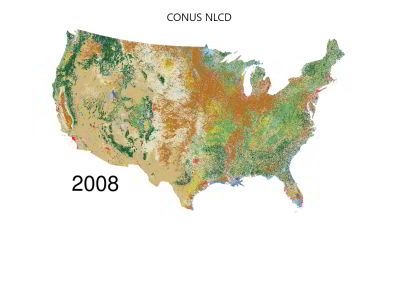
Land cover attribute data visualization and download web application.
A tutorial on spatially segmenting an image based on biomass distribution for a watershed in Oregon Cascades using Python's scikit-image library.
A Leaflet application that contains many random subsets of predicted land cover time series videos for CONUS 1984-2017.
A Leaflet application showing a satellite image time series of the region around MT Hood in NW Oregon 1984-2016.
A multi-page research lab website to convey projects, tools, scholarly activity, and share data views. AngularJS was used to dynamically insert HTML blocks based on a JSON array to reduce manual code repetition. It also includes vanilla JavaScript to produce a parallax scrolling effect on the landing page.
An example of digital environmental site assessment report tables and figures. This application uses R Shiny as the HTML and JavaScript interface and Shinyapps.io as the hosting service.
An application to initialize an automated satellite image georegistration program with a few tie points as a hint about where to start. The app uses an image zoom and pan library and custom functions to place and record tie points, keep track of tie points, and allow the user to download placed tie points as a JSON file.
An interactive map that shows geolocated photos for field sites visited in Mount Rainier National Park. Having the georeferenced photos helps interpret the two satellite image base layers.
A tutorial on creating a tile mapping service data set from your own raster data using GDAL.
A data download portal for forest disturbance data in Washington, Oregon, and California. This application uses PHP to capture client-side data selection options and initiate server-side Python scripts to process the data request.
An interactive web map showing vegetation change in the Western Carpathians based on Landsat satellite imagery. Leaflet was used as the web mapping API and jQuery was used for updating image transparency upon slider position change.
A fishy application for interactively calculating sex ratios. The application uses jQuery to track objects and update calculations upon interaction.
My personal website. A clean example of my love for satellite imagery, coding, and data visualization. D3.js and jQuery are used in the plots, and a neat image magnification function is bound to the satellite image.
A multi-page site for documenting software I developed to process Landsat satellite imagery.
A time-lapse video of urban expansion in Las Vegas based on a 34-year time series of Landsat imagery. Leaflet was used as the web mapping platform.
An interactive web mapping application showing a time-lapse video of landscape change, based on Landsat imagery, for a national monument in Oregon. The web mapping platform is Leaflet and it takes advantage of a side panel plugin to convey information about the region.
A data visualization showing a time series of Landsat satellite images temporally linked to three spectral transformation plots showing the median value for the image. This page uses D3.js for plotting and jQuery to coordinate the plot and video frames.
An interactive data visualization showing annual vegetation phenology in Landsat imagery for several spectral indices. The plots are made using Plotly.js.
An interactive web mapping application showing a time-lapse video of landscape change, based on Landsat imagery, for Mount Rainier, WA. The web mapping API is Leaflet. The base maps can be switched and the transparency of the video can be adjusted.
A multi-page site for documenting an algorithm I developed to automate the identification of clouds and cloud shadows in Landsat MSS satellite imagery.
A data visualization showing a series of videos that demonstrate land cover change for a sample of regions throughout the United States.
A personal site for my wonderful wife. It includes vanilla JavaScript to produce a parallax scrolling effect, modals, and a Leaflet location map.
An application that plots Palmer Drought Severity Index time series for regions within the United States. The web map is built with Leaflet and the plotting is handled with Plotly.js.
An instruction guide for creating Sankey diagrams showing from-to change for classified land cover maps using R and a D3 integration library.
An application to determine the sun angle at the time of Landsat image acquisition for any day and location on Earth. The web map platform is Leaflet and the plotting is handled with the Chart.js API.
A Landsat image time series exploration tool. The application includes a pixel time series profile and image subsets for pixel context. The time series plot was built with D3.js and the image chips are HTML canvas elements. It also includes a time-lapse video of the image chips and a Google Map for added spatial context.
An interactive web map showing pre- and post-fire Landsat satellite images for the 2017 West Mims fire near the border of Florida and Georgia. The application includes a custom side panel with options to toggle image display, adjust transparency, and flicker the images to show fire effects.
A tool for evaluating the effect of parameter change for a Landsat change detection algorithm. This application uses Leaflet for the web map platform and Chart.js for the plotting.
A visualization showing a time-lapse video of spectral change recorded by Landsat satellite sensors from 1990-2016.
A visual demonstration of a satellite image cloud and cloud shadow identification algorithm I developed. It uses CSS to change the position of an image sprite on hover. This method is much quicker than loading a replacement image, which allows for a seamless transition - a better user experience.
A description page (under construction) for a Landsat-based change detection algorithm. This page uses a scroll position tracking JS library to animate the entry and exit of elements.